
WELCOME
Dear Visitor,
Welcome to my website!
My portfolio showcases a range of diverse projects I've been involved in, demonstrating my passion for data analysis and the insights it can uncover. Among these projects are:
Harry Potter and the Deathly Hallows Part One Sentiment Analysis and Social Network Relationship" explores the sentiments and interpersonal dynamics within the famous Harry Potter franchise.
No-Show Predictive Model & Proactive Outreach Strategy
Philadelphia 311 Call center Staff Scheduling Optimization
Data Analytics Project with Yellow Dig": A collaborative project that applies data analysis strategies to real-world situations.
Analytics Consulting Project with PWC": An in-depth consulting project with one of the most respected firms in the world, where I applied my data analytics skills to solve complex problems related to the U.S. population's Covid-19 vaccination intention.
2021 League of Legends Linear Regression Analysis": A deep dive into the statistics of one of the most popular online games, using linear regression models to predict game outcomes.
Analysis of housing market in Two US cities From 2020 to 2022.": My most recent project, where I analyzed the housing market trends in two major US cities over a two-year period
I firmly believe that we live in an era saturated with data, yet our ability to transform this data into actionable information lags. This is where my work as a data analytics professional comes in. By employing sophisticated analysis methods, I aim to bridge this gap, thereby enhancing decision-making progress, improving project outcomes, and reducing project costs.
Feel free to explore, and I welcome any feedback that could help me improve.
Best Regards
Luke
Harry Potter and the Deathly Hallows Part One Sentiment Analysis and Social Network Relationship
Harry Potter holds a special place in my heart, as it was the first novel ever read from the Western world. I can still vividly recall those long summer days I lying next to my grandfather, engrossed in the pages of this enchanting tale.
The magical world crafted by J.K. Rowling captivated my young imagination, transporting me to a place far beyond the confines of my everyday life.
I still recall the mixed feelings I experienced when I first watched the inaugural movie in the series. I was entranced, yet also deeply disappointed - I remember asking my mom, with a heart heavy with longing. " why didn't they pick me to go to Hogwarts?" This poignant memory of my childhood continues to resonate with me.
The inspiration for this project came from Professor Murugan Anandarajan, affectionately known as Doctor A. He tasked us with undertaking a Natural Language Processing (NLP) project related to the Harry Potter movies. Our group was assigned the last film in the series, 'Harry Potter and the Deathly Hallows Part One ', which we all thoroughly enjoyed.
Capitalizing on our NLP skills and enthusiasm for the film, we decided to use technology to streamline the role-playing game (RPG) development process. Our ultimate goal was to create a data-driven approach to game design.
Our first objective was to identify the key characters using social network analysis. Next, we sought to comprehend the overall mood and tone of the game using sentiment analysis. With this information, we aimed to create dialogues for these characters. The choice of words, tone of the dialogues, and character interactions were all designed based on word frequency and sentiment analysis.
By integrating these elements, we strived to create a more immersive and engaging gaming experience, one that would truly capture the essence of 'Harry Potter and the Deathly Hallows Part One'.

Social Network Analysis
Social Network Analysis (SNA) is a methodological approach that focuses on understanding the relationships among social entities and the patterns and implications these relationships create. It serves as a tool to map and measure the interactions and flows between various entities, such as people, groups, organizations, computers, URLs, and other connected information or knowledge entities.
Three Crucial components come into play when visualizing networks: nodes, lines and layout. In the context of lines, networks can be either directed or undirected. In undirected networks, the lines are termed 'edges.' For instance, an edge would be appropriate for a study analyzing the relationship between Harry and Hermione from the Harry Potter series. This is because their interaction in the narrative is mutual, and no directed line is needed to represent a one-way interaction.
In contrast, directed networks feature 'arcs,' which essentially denoted lines with arrows indicating the directionality of the tie. The concept of reciprocity of the tie becomes an important feature in these networks. Consider a hypothetical study on children's friendships: understanding who nominates whom as a friend and whether this nomination is reciprocated could provide significant insight into the nature of these relationships. It's more likely that a friendship is mutually recognized when the nomination is reciprocated. By paying close attention to these details, SNA can provide a deeper understanding of the dynamics within social networks.
In this graph. I've used the level of reciprocation to determine the size of the 'Evil' network. As we can see, Lord Voldemort stands as the largest node, reflecting his pivotal role in this network.
Lord Voldemort's request for the Elder Wand, which leads him to interact with Gregorovitch, Ollivander, and Grindelwald, significantly highlights his dominance and central role in the story. His connections with these key characters expand his network and emphasize his pivotal role and significant influence within the unfolding narrative. These interactions illustrate how his actions and decisions propel the storyline, further reinforcing his centrality and importance to the plot.

A cluster in a social network refers to a group of nodes that are more interconnected among themselves than with other nodes in the network. These clusters can provide valuable insights about collections of individuals and the dynamics of their interactions.
One important technique used in the study of clusters is community detection, which aims to identify such tightly-knit groups within a larger network. This can help us understand how different sub-networks or communities interact with each other and whether there are distinct communities within the larger network. This graph shows that the green cycle at the left corner represents the Ron Weasley family.
While clustering provides significant insights, it's important to recognize its limitations. For instance, consider the character Mr Scabior from the Harry Potter series. In the first part of 'Deathly Hallows', Scabior captures Harry, Hermione, and Ron and takes them to Bellatrix's house. Though he plays an antagonistic role, the clustering algorithm could potentially misidentify him as a part of the 'good' group due to his frequent interactions with the main characters. This highlights the importance of considering the context and nature of interactions when interpreting cluster analysis results.
Another critical application of clustering lies in community detection. Let's consider the study of communicable diseases. Here, it's essential to identify individuals connected to many others, say 20 people. These individuals, often called 'super spreaders', can significantly impact the disease's spread due to their extensive network of contacts. Identifying and examining these clusters can better understand disease transmission patterns and devise more effective containment strategies. In our graph, we need to pay more attention to Harry, Hermione, Ron, and Lord Voldemort. This is a prime example of how the principles of Social Network Analysis can be applied to the health care industry.

In continuation of our exploration of communicable diseases using social network analysis, we could see clusters to identify distinct groups within a community and pinpoint the most influential individuals within each cluster. However, to identify individuals who connect different subgroups, we must consider a concept called "betweenness centrality."
Betweenness centrality is a measure of a node's role as the bridge between other nodes. In simple terms, it quantifies how often a node serves as link, or 'bridge,' connecting various parts of the network. If we look at the 'good characters' network from Harry Potter, Harry has the highest betweenness centrality. This means he often serves as a bridge, connecting different groups of characters together. People with high betweenness centrality tend to unify the network.
Relating back to our disease control example, we should pay particular attention to individuals who connect numerous groups. These individuals can serve as significant transmission points for diseases, given their extensive connections. Remember, different people hold importance for various reasons within a network, so our understanding is often a composite picture, a blend of different measures and perspectives.

In the context of a network:
1. A "hub" is a node that has many outbound links; it points to many other nodes. In a social network, a person who follows many others would be considered a hub. In the context of web pages, a page that contains many links to other pages is a hub.
2. An " authority" is a node with many inbound links; many other nodes point to it. In a social network, a person who is followed by many others is an authority. In terms of web pages, a page that is linked to by many others is an authority.
Eigenvector centrality is a measure of the influence of a node in a network. It assigns relative scores to all nodes in the network based on the concept that connections to high-scoring nodes contribute more to the score of the node in question than equal connections to low-scoring nodes.
In simpler terms, eigenvector centrality doesn't just look at the number of connections a node has (as in the case of degree centrality), but it also considers the quality of these connections. If a node is connected to others that have a high degree of connections themselves, then the node in question is considered to be more central.
A well-known application of this concept is Google's PageRank algorithm. The web pages you see in your search results aren't ranked solely based on the number of other pages linked to them but also on the quality (importance) of those linked pages.
If we come back to our story, after calculating Eigencentrality, I have some interesting founding. After three main characters, I found these three people play a pretty important role in Eigencentrality, including the Mundungus, Lovegood, and Scrimgeour. With my founding, I come back to look the movie again.
Mr Mundungus
Mr Mundungus enters the scene early in the film, joining five other brave Order of the Phoenix members. Their mission is paramount: to ensure Harry Potter's safe transportation to a secure location. Further into the movie: Mr Mundungus proves instrumental once again, providing a crucial hint that reveals the location of the first Horcrux. Thus, despite his sometimes dubious character, Mundungus plays a vital role in unfolding events.
Xenophilius Lovegood
Harry, Ron, and Hermione visited him. Xenophilius alerted Death Eaters, hoping they would return Luna in exchange. While waiting for the Death Eaters' arrival, Xenophilius told the trio about the Deathly Hallows.
Scrimegeour
The minister of magic, Scrimgeour, bombarded the trio with questions, attempting to discern Dumbledore's intentions, and was highly suspicious of the gifts he had left them: the Deluminator for Ron, a Golden Snitch for Harry, and an original copy of The Tales of Beedle the Bard for Hermione.

The R packages we're using include NRC, Wordcloud, Bing, Loughran, and Afinn. These are renowned lexicons commonly employed in Natural Language Processing (NLP).
The NRC, Bing, Loughran, and Afinn lexicons serve a similar purpose: they translate every English word into fundamental emotions and sentiments. Specifically, they categorize words according to basic emotions such as anger, fear, anticipation, trust, surprise, sadness, joy, and disgust, as well as two overarching sentiments: negative and positive.
For instance, the word "happy" is linked to positive emotions such as joy, while "murder" is connected with negative emotions like anger, fear, and sadness.
These lexicons are particularly useful in emotion and sentiment analysis. They facilitate the detection of sentiments and emotions in text, going beyond a simple dichotomy of positive and negative sentiment. By interpreting the text a person writes or the dialogue they engage in, these tools can help discern the intensity and type of emotions evoked. It's important to note, however, that while these lexicons offer substantial insight, they may not fully capture nuances, irony, or context-dependent sentiment in text.
I conduct a sentiment analysis on each line of the script, averaging the scores and presenting them in the bar chart. This gives us a general sense of the emotional trajectory of the entire film.
Notably, there's a significant dip in sentiment scores around the midpoint of the movie, coinciding with Ron's departure from the team. The sentiment score then markedly increases when they successfully destroy the first Horcrux. However, there is a downward trend towards the end of the film, particularly with Dobby's death, reflecting the emotional weight of that scene. This analysis visually illustrates the highs and lows of the film's narrative as perceived through sentiment scores.


The 'word cloud' package in R is a popular tool for creating a word cloud
cloud (or tag cloud) is a visual representation of text data where the size of each word indicates its frequency or importance in the source data.
1. Frequency Representation: The primary use of the 'word cloud' package is to represent the frequency of words in a text dataset visually.
2. Customization: You can customize various aspects of the word cloud, such as the maximum number of words to be displayed, the color of the words, the shape and layout of the cloud, and more.
3. Comparison Clouds: The package also provides a "comparison. cloud" function, which can be used to create a word cloud comparing word frequencies across different groups in the data.
Next, we performed an analysis of key character interactions using Bing and sentiment packages.
Our analysis revealed that approximately 86% of the words were neutral, with 7% each being classified as positive and negative.
When we examined individual characters, we found Harry's dialogue leaned towards positivity, while Hermione and Ron's dialogues veered towards negativity.
Interestingly, our character interaction analysis showed a positive sentiment for the Harry Hermione and Hermione-Ron dynamics. However, the sentiment was negative for the Harry - Ron interactions.
Overall, the script maintains a balanced distribution of negative and positive sentiments, indicating a well-rounded emotional trajectory throughout the narrative.
By integrating social network analysis, sentiment scoring, and word frequency analysis, we can drive game development in a more data-oriented manner. Taking Harry Potter as an instance, the concept of data stitching enables us to determine the most fitting words and tone Harry should use in specific scenarios within the game.
Let's consider an early-game scenario where all characters are gathering to escape to a safe house, and Harry is conversing with Hermione.
Given that the overall sentiment at the beginning of the game leans slightly positive, and considering his interactions with Hermione are positive, we can inform his dialogue accordingly.
In this context, words such as "Good", "Brilliant","Great","Thank" and "Promise" could be suggested for Harry's dialogue with Hermione, delivered in a tone of positivity or hope. This data-driven approach ensures character interactions are consistent with the sentiment and tone established in the original narrative.


As previously discussed, social network analysis can be instrumental in controlling community-level infections. Furthermore, we can also harness Natural Language Processing (NLP) technologies in the healthcare sector.
1. Sentiment Analysis: We could perform sentiment analysis for Electronic Health Records (EHRs). For example, patient correspondence or notes might reflect distress, satisfaction, or other emotions relevant to care.
2. Named Entity Recognition (NER): NER can be extremely useful for EHRs. It can help identify and categorize specific entities in the text, such as disease names, medication names, symptoms, etc. This can help to convert unstructured data into a structured format that can be more easily analyzed.
3. Combine Social Network Analysis, Sentiment Analysis, and Time Series Analysis, we can acquire a holistic understanding of a patient's treatment journey within the hospital. This comprehensive view can lead to more personalized care and improved patient outcomes.
No-Show Predictive Model & Proactive Outreach Strategy
The primary objective of this initiative is to implement a data-driven framework to proactively identify no-show risk prior to appointments. By anticipating these events, we aim to optimize clinical throughput, minimize vacancy rates, and improve long-term patient retention.
Project Scope:
Phase 1 Exploratory Analysis: We will investigate key patient characteristics and environmental factors to identify the root drivers of appointment non-attendance.
Phase 2 Predictive Modeling: We will deploy an XGBoost machine learning model to accurately predict the probability of patient attendance for upcoming appointments.
Phase 3 Operational Intervention: We will translate risk predictions into an actionable strategy, empowering frontline staff to prioritize resources and engage patients who are at the highest risk of missing their appointments.
Data Overview:
Our descriptive analysis is based on over 10 million clinical visit records spanning the last ten years across our Pennsylvania (PA) and Delaware (DE) sites. We observed a consistent year-over-year increase of 4% in service volume. Pennsylvania sites currently account for the majority of our appointment and service volume compared to our Delaware locations.
Patient Profile & Service Utilization:
-Demographics: The average patient age is 53.5 years. The gender distribution is 51.1% female and 46.9% male.
- Clinical History: Approximately 17.7% of our patient population has a documented history of substance abuse.
- Service popularity: General Counseling is the most utilized service, followed by community wellness, Intensive outpatient programs, and SUD recovery services.
Patient Segmentation (Clustering Analysis)
To better understand our patient base, we used K-Means clustering, an unsupervised machine learning technique. Utilizing the Elbow Method, we determined that k=4 was the optimal number of clusters for our population.
Our analysis identified that Cluster 1 (35% no show rate) and Cluster 3 (31% no-show rate) exhibit significantly higher rates of appointment non-attendance compared to other groups. Consequently, our subsequent modeling efforts focused specifically on profiling these two high-risk patient cohorts.


Cluster 1: The Psychosocial Engagement Group
This cohort is characterized by a significant history of substance use; however, they possess reliable transportation and live within an accessible radius of our facilities. Data suggests their non-attendance is not driven by logistical obstacles, but rather by diminished clinical engagement or motivational barriers.
Recommended Interventions:
Targeted Motivational Interview (MI): Implement early-intervention screenings focused on behavior health and motivational interviewing prior to the appointment date to boost patient readiness.
Telehealth integration: Offer flexible telehealth options to reduce the friction of in person attendance for patients experiencing low internal motivation.
Cluster 3: The Access Barrier Group
This cohort represents a “Logistical access” Challenge. Our geographic analysis (based on patient zip codes) confirms that these patients reside, on average, significantly further from our clinic locations than other groups. Coupled with a lack of reliable transportation, the physical barrier to entry is the primary driver of no-shows.
Recommended Interventions:
Transportation support: Develop a voucher program or partner with ride-share services to alleviate the primary barrier to physical attendance.
Service Decentralization: Prioritize this group for telehealth appointments, shifting care to virtual platforms to bypass the need for physical travel entirely.
Geographic Outreach: Utilize our distance analysis data to identify specific regions where we may need to establish satellite partnerships or mobile outreach service in the future.


Predictive Modeling Strategy & Findings
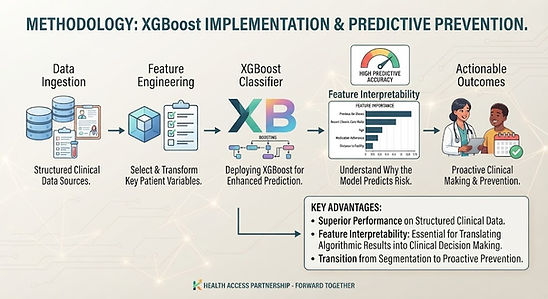
Methodology: XGBoost Implementation
To transition from patient segmentation to proactive prevention, we deployed the XGBoost classifier. We selected XGBoost due to its superior performance on structured clinical data and its ability to offer feature interpretability. Which is essential for translating algorithmic results into clinical decision making.
Our preprocessing steps included the removal of administrative identifiers (Appointment IDs) and timestamps to prevent data leakage.
Addressing Data Challenges
-
Challenge 1: Class Imbalance (13% No-Show Rate)
-
The Risk: Standard models favor the majority class, missing potential no-shows.
-
The Solution: Implemented cost-sensitive learning via scale_pos_weight to increase the predictive importance of minority class (no-shows).
-
-
Challenge 2: Data Aging / Concept Drift
-
The Risk: Historical data (10 years) may not reflect current patient behavior.
-
The Solution: Applied a time-decay factor to prioritize recent data, ensuring the model adapts to current patient behavior and recent system changes
-
Model performance
Following a 3-fold cross-validation grid search to identify optimal hyperparameters, our model achieved the following performance metrics:
Recall: 0.68 – We successfully captured 68% of actual no-show patients
Precision 0.40 – This represents the accuracy of our warnings, balancing the need to catch potential no-shows against the risk of over-alerting
ROC-AUC 0.72- This score confirms that our model has strong capability to distinguish between patient who will attend and those at risk of missing their appointment.
Key Driver of Appointment Attendance
Our analysis identified the top five factors that a most heavily influce the likelihood of a no-show
-
Extreme Weather
-
Prior Substance Abuse History
-
New Patient Status
-
Stable Transportation
-
Income level
These predictive findings both validate and deepen our earlier cluster analysis. While clustering enabled us to identify who is at risk, the XGBoost model elucidates the drivers behind that risk. By combining these methodologies.we have successfully transitioned from broad patient segmentation to highly targeted, data-informed interventions for our outreach teams.
Probability Estimation & Tiered Intervention Strategy
-
Probability Calibration
To move from a binary prediction to a nuanced risk assessment, we convert our model’s output into a probability score using two-steps process:
Logit scoring: The XGBoost model assigns a raw score (Log-odds) to each patient based on their decision path through the decision trees. During this phase, we apply our scale_pos_weight adjustment to calibrate the model, ensuring that the minority class (no_shows) is adequately represented and not overshowed by the majority.
Sigmoid Transformation: We apply the Sigmoid function to these raw scores, mapping them into a probability range between 0 and 1. This provides us with a standardized likelihood score for every appointment.
Risk Stratification and Operation Logic
With a calculated probability score for each patient, we have implemented a tiered outreach strategy. By categorizing risk, we ensure that our frontline staff directs their limited time and resources to where they are needed most.


· Tier 1: Proactive Digital Engagement (85% – 95% Probability)
· Action: Automated SMS Reminder.
· Objective: For patients in this "High Risk" tier, we utilize automated messaging to gently nudge them, address minor forgetfulness, and provide easy tools for rescheduling without burdening our frontline staff.
· Tier 2: High-Touch Clinical Intervention (>95% Probability)
· Action: Direct Outreach / Phone Call.
· Objective: These patients are identified as "Extreme Risk." Because the model indicates a near-certain likelihood of a no-show, we trigger a direct, personal outreach. This allows our workers to have a meaningful interaction, identify the specific barriers (e.g., transportation issues or motivational challenges), and offer immediate assistance.

Philadelphia 311 Call center Staff Scheduling Optimization
Philly 311 is Philadelphia’s official non-emergency customer service center, serving as a critical bridge between residents and local government. It handles everything from reporting potholes and missing trash pickups to answering general municipal inquires.
The primary objective of this project is to transition the center’s staffing strategy from experience-based estimation to data-driven optimization. Utilizing historical data from January to July 2026, we developed a robust time series analysis model to accurately forecast daily call volumes. By integrating these predictions with a modified Erlang-C model, we generated a highly granular, hour-by-hour staffing schedule. The end-to-end pipeline ensures optimal resource allocation, improves serve level agreements (SLAs) , and prevents both overstaffing and operational bottlenecks.

Our initial exploration of the Philly 311 daily call volume reveals highly stable baseline with clear weekly seasonality. On a typical weekday, the volume consistently hovers around 2000 calls, followed by sharp drops during the weekends. The only major anomaly occurred in early February 2026, where the call volume spiked to nearly 6000, a 300% increase compared to the baseline – likely driven by a severe winter storm. Beyond this weather – related event, the overall volume trend remains stationary.
During the data preprocessing stage, we first verified data integrity and found no missing values in the dataset. To account for the sharp drops in call volume during non-working days, we engineered exogenous binary features to flag weekends and holidays. To handle extreme anomalies, we applied statistical, capping any outlier at our predefined upper and lower control limits. Finally, we evaluated the dataset for stationarity using Augmented Dickey-Fuller (ADF) test. The initial test yielded a p-value of 0.288, indicating non-stationarity. Consequently, we applied first-order differencing and re-ran the ADF test, which in a p-value of <0.05 confirming the series was strictly stationary and ready for modeling.

Next, we performed a seasonal decomposition to better understand the underlying structure of our time series. The decomposition yielded three key insights: First, the Trend component clearly captured the massive surge in early February, mathematically validating the prolonged operational impact of the winter storm. Second, seasonal component confirmed a strict 7-day weekly cycle, serving as foundation for our seasonal modeling parameters.
Finally, analyzing the Residuals revealed significant negative occurring in mid-February, early April, late May, and early July. These correspond exactly to major holiday, including President’s Day, Good Friday, Memorial Day, and Independence Day. This indicates that holidays trigger unexpected, sharp drops in call volume. Notably, since Good Friday is not a standard federal holiday but heavily impacts our operations, we manually hard coded it as holiday feature in our dataset.

Following the stationarity checks, we analyzed the Autocorrelation Function (ACF) and Partial Autocorrelation Function (PACF) plots to determine the initial parameters for our time series model.
The ACF plot displays significant, repeating spikes at lags 7, 14, 21 and 28, confirming a strict weekly seasonality (m=7). Furthermore, the PACF plot exhibits a significant spike precisely at lag7 before tapering off, which strongly indicates the need for a Seasonal Autoregressive term (P=1),
Regarding the non-seasonal components, the early significant lags in both plots suggest a complex short-term dependency. Based on these visual diagnostics, we established p=2 and q =2 as our baseline parameters. These initial values will serve as the starting point for our hyperparameter tuning and model optimization.

Using Auto-ARIMA with is_holiday and is_weekend as exogenous variables, our optimal model was identified as SARIMAX(11,0)X(1,0[0],7).
The summary results perfectly validate our feature engineering both is_holiday (coef:-1498) and is_weekend (coef:-1732) display highly negative coefficients with p-values of 0.000 This statistically confirms that weekends and holidays drive massive, quantifiable drops in call volumes.
Examining the internal mechanics:
-
AR(1) [coef:-0.1236, p<0.05]: indicates a slight mean-reverting effect in the short term an unusually high volume yesterday often leads to a relative smaller volume today.
Seasonal AR (7)[coef: -0.5562, p =0.001]: Acts as an error-correction mechanism. If a random, extreme external shock caused a volume spike last week, this negative coefficient ensures the model does not blindly expect the same anomaly to repeat this week.

To evaluate out-of-sample performance, we split the data set, reserving the final 30 days as strict testing blind set. The model achieved a Mean Absolute Error (MAE) of 211.96 calls/day and Root Mean Squared Error (RMSE) of 326.73 calls/day. From an operational standpoint, this MAE indicates that our daily scheduling only needs a highly manageable buffer of approximately 2 to 3 staff members to over routine prediction variances.
Furthermore, we evaluated the model using a Weighted Mean Absolute Percentage Error (WMAPE) rather than standard MAPE. We explicitly chose WMAPE because standard MAPE is heavily distorted by the ‘Small denominator problem’ during low-volume days (such as late-night or holiday shifts), inflating the error rate despite negligible operational impact. Our resulting WMAPE of 18.14% proves that, across the entire month, the model successfully captures over 80% of the true macro-level demand, making it highly reliable for production-level workforce allocation.

To translate our daily forecasts into actionable operational metrics, we analyzed the historical average call volume by local hour. This revealed a sustained peak demand window between 9:00 AM and 3:00 PM. We then normalized these hourly averages by dividing each hour's mean volume by the daily sum, creating a standardized 'local hourly ratio.'
By multiplying our SARIMAX daily volume forecasts by this ratio, we generated highly granular, hour-by-hour volume predictions. Finally, to determine the actual headcount required per hour, we applied a workload formula incorporating our operational constraints:


This end-to-end pipeline ensures our staffing levels dynamically match the predicted micro-level demand while protecting agent bandwidth.
Data Analytics Consultant - Yellow Dig
I provided data analytics consultation for Yellowdig, a modern online learning platform that fosters student engagement through peer-to-peer interaction.
The project aimed to identify key performance metrics to assess the overall health of the platform. My primary focus was analyzing student engagement within online communities to uncover patterns, measure participation quality, and generate actionable insights to enhance user experience and interaction.
Additionally, I conducted client segmentation based on key characteristics of partner relationships and project management practices. This segmentation helped inform tailored engagement strategies and improve partner success outcomes.

Multi-Linear Regression Model
To identify the most critical features impacting our target variable, I implemented a two-step process. The first step involved building a Multiple Linear Regression model to guide initial feature selection.
During this process, I encountered two key challenges:
-
Multicollinearity: Several variables were highly correlated, which I addressed by calculating the Variance Inflation Factor (VIF) and removing features with high VIF scores.
-
Non-normality: The dataset exhibited significant skewness and kurtosis. To normalize the data and improve model stability, I applied logarithmic transformations to the most skewed variables.
The refined model delivered strong performance, achieving:
-
Mean Squared Error (MSE): 0.074
-
Mean Absolute Error (MAE): 0.211
-
Root Mean Squared Error (RMSE): 0.273
-
R-squared (R²): 0.922, indicating high explanatory power.
Decision Tree Model
Following the feature selection process, I implemented a Decision Tree Classifier to model and interpret the drivers of the Total Health Score, which serves as a composite engagement metric.
Target Variable Engineering
To frame the problem as a binary classification task, I binarized the Total Health Score:
-
Assigned a value of 0 to all records with a score < 100
-
Assigned a value of 1 to records with a score ≥ 100
This transformation helped differentiate between low and high community engagement levels on the Yellowdig platform.
Data Preparation and Modeling Approach
-
Train-test split: I partitioned the data using an 80/20 split, ensuring stratification to maintain class balance.
-
Cross-validation and hyperparameter tuning:
-
Performed grid search over the complexity parameter (cp) from 0 to 0.05 in steps of 0.005
-
Used 10-fold cross-validation, repeated 3 times, to reduce model variance and improve robustness
-
-
Modeling library: The Decision Tree model was built using the rpart package in R, allowing for fine control of splitting criteria and tree pruning.
-
Splitting criterion: The model used Gini impurity to determine the best feature splits at each node.
Model Performance
-
Optimal cp value: 0.005, based on minimizing cross-validated classification error and avoiding overfitting.
-
Training accuracy: 87%
-
Testing accuracy: 86%, indicating good generalization
-
Confusion matrix and precision-recall: Evaluated true positives and false negatives, showing balanced performance across classes
Feature Importance (Variable Importance Plot)
Top predictors of high engagement included:
-
Comment Count – the most influential feature, indicating active discussion is central to community health
-
Word Count – richer, more detailed posts correlated with higher scores
-
Post Views Count – visibility drives perceived value
-
Reaction Count – likes and reactions serve as social validation signals
Interpretability & Actionable Insights
The tree structure provided clear if-then rules, offering interpretability to stakeholders. For example, if a post had a high number of comments and word count, it was more likely to be classified as “healthy.”
Cluster Analysis
To support strategic marketing decisions and optimize employee-partner alignment at Yellowdig, I conducted a Cluster Analysis on two datasets: Closed-Won Clients and Active Pipeline Clients. The goal was to uncover patterns in industry types, education levels, and other partner characteristics that could guide personalized engagement strategies and resource allocation.
Methodology
Given the presence of both categorical and numerical variables, I selected the K-Medoids algorithm (Partitioning Around Medoids - PAM) over K-Means due to its robustness to outliers and ability to use custom distance metrics. Unlike K-Means, K-Medoids minimizes the sum of dissimilarities (e.g., Gower distance) instead of squared Euclidean distances, making it ideal for mixed-type data.
Data Preprocessing
-
Missing values: Applied mean imputation for continuous features and mode imputation for categorical variables
-
Standardization: Employed the Yeo-Johnson transformation, which handles both positive and negative values and reduces skewness to ensure features are on a comparable scale
-
Encoding: Transformed categorical variables using one-hot encoding where appropriate for clustering compatibility
Optimal Number of Clusters (k)
To determine the optimal number of clusters:
-
Used the Silhouette Coefficient, which measures cohesion and separation
-
Evaluated k in the range of 2 to 10, selecting the value that maximized the average silhouette score
-
Visualized silhouette width for interpretability of cluster quality
Implementation
-
Distance metric: Used Gower distance, which accommodates mixed data types and scales them appropriately
-
Libraries/tools: Implemented using the cluster and factoextra packages in R (or scikit-learn + gower in Python)
Results & Insights
The clustering revealed distinct partner segments with shared characteristics across dimensions such as:
-
Institution type (e.g., R1 universities, liberal arts colleges, edtech firms)
-
Engagement stage (early adoption vs. established clients)
-
Primary use case (course-level discussion, campus-wide initiatives, alumni engagement)
These insights allowed Yellowdig to:
-
Tailor marketing materials and outreach strategies per segment
-
Assign account managers based on historical fit with similar partners
-
Identify underpenetrated sectors for proactive pipeline development
Interesting Finding and Impact
Our analysis uncovered key insights that informed actionable business recommendations for Yellowdig. Historically, Yellowdig focused primarily on college students as its core user base. However, our data revealed significant engagement from K–12 institutions, particularly in the Northeast region.
This emerging trend highlights an opportunity for market expansion. We recommended that Yellowdig:
-
Recognize K–12 educators and students as a growing user segment
-
Develop tailored service offerings to meet the unique needs of K–12 classrooms
-
Adjust marketing strategies to engage decision-makers in school districts and educational networks
By acting on this recommendation, Yellowdig can diversify its customer base and strengthen its position in the broader education technology market.


Analytics Consulting PriceWaterHouseCoopers About COVID-19
Descriptive Analysis
The first objective was to quantify and visualize the societal impacts of the pandemic across critical domains:
I used tools such as Pandas, NumPy, Matplotlib, and Seaborn (Python) to perform exploratory data analysis and visualize regional and temporal trends from the survey.
-
Childcare and Education
-
Employment and Labor Participation
-
Food Security and Health
-
Housing Stability
-
Household Spending Behavior
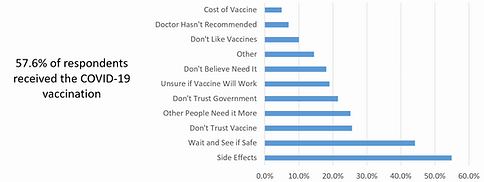
Predictive Modeling: Vaccination Intent Classification
The second goal was to build a machine learning classification model to predict vaccination intent among the U.S. population based on behavioral, economic, and demographic features.
The final model achieved strong predictive performance, allowing PwC stakeholders to identify populations with vaccine hesitancy and tailor communication or resource deployment strategies accordingly.
-
Sample period: January to July 2021, capturing the dynamic rollout phase of the vaccination program
-
Target variable: Intention to receive a COVID-19 vaccine (e.g., "Definitely will", "Probably will", "Probably not", "Definitely not")
-
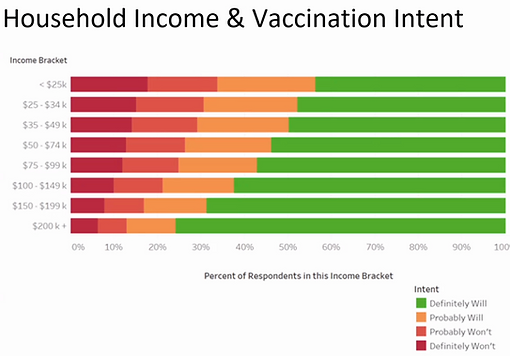
Feature engineering: Included variables such as household income, education level, geographic region, healthcare access, and prior COVID-19 exposure
-
Modeling techniques: Evaluated multiple classifiers including Random Forest, XGBoost, and Logistic Regression
-
Evaluation metrics: Used accuracy, F1-score, ROC-AUC, and confusion matrices for model performance comparison


Descriptive analysis
Descriptive Analysis Summary
For the exploratory component of the project, I analyzed a robust dataset containing 884,695 observations and 136 variables, of which 114 were categorical. This analysis aimed to uncover patterns across demographic, socioeconomic, and behavioral indicators in relation to COVID-19 impacts.
Demographic Overview
-
Gender: 59.5% of respondents were female
-
Race: 84% identified as Caucasian
-
Education:
-
13.6% completed high school or less
-
60.8% had some college or a college degree
-
18.4% held graduate-level education
-
-
Marital Status:
-
18.4% never married
-
58.3% married
-
22.5% widowed, separated, or divorced
-
-
Median birth year: 1966
-
Average household size: 2.72 individuals
Key Insights
-
Vaccination Intent:
Non-vaccinated individuals were more likely to be younger, have lower income, and possess lower levels of education. -
Temporal Trend:
A time-series analysis revealed that vaccine hesitancy increased notably between week 22 and week 33, with a growing share of respondents indicating refusal to get vaccinated.
Clustering Analysis Within Descriptive Framework
To enhance segmentation, I conducted hierarchical clustering using Ward’s method, which minimizes the total within-cluster variance at each merge step.
-
Distance Metric: Euclidean
-
Cluster Validation: Used the cophenetic correlation coefficient, which measured 0.39, indicating a moderate level of clustering structure.
Cluster Findings
-
Cluster 2: Individuals in this group experienced the highest levels of unemployment and elevated reports of mental health challenges, highlighting a vulnerable subpopulation within the broader dataset.


Predictive analysis
Target Variable: Vaccine Intent
To prepare the dataset for modeling vaccine intent, I applied the following preprocessing steps:
-
Filtered out vaccinated individuals to focus on unvaccinated respondents
-
Excluded missing values for the target variable to ensure label integrity
-
Removed follow-up questions related to vaccine intent to eliminate redundancy and reduce response bias
Dimensionality Reduction
To reduce noise and improve model performance, I systematically removed:
-
Variables specific to Phase 3 and 3.1 of the Census Bureau survey
-
Conditional survey questions not consistently asked across all respondents
-
Irrelevant features such as vaccine access/logistics questions not predictive of intent
-
Rows with >20% missing values
-
Applied downsampling to correct for class imbalance in the target variable
After cleaning, the dataset included:
-
374,908 observations
-
119 total variables
-
8 numerical
-
96 nominal
-
16 ordinal
-
To predict vaccination intent, I used a Decision Tree Classifier, which provides interpretability and rule-based segmentation.
Train/Test Split
-
70/30 split for training and evaluation
Class Imbalance Handling
-
Observed a skewed class distribution
-
Applied random downsampling on the training set to ensure class balance
-
Used 5-fold cross-validation, repeated 3 times, during training to stabilize performance
Hyperparameter Tuning
Decision trees can easily overfit training data. To mitigate this, I implemented:
-
Grid search over the complexity parameter (cp) range from 0 to 0.05, in 0.0005 increments
-
10-fold cross-validation, repeated 3 times for robust tuning
-
Optimal cp identified at 0.0005, producing the highest validation accuracy
Model Performance
-
Final accuracy on test set: 68%
-
Despite moderate accuracy, the model revealed clear rules and feature splits related to demographic and socioeconomic indicators
Random Forest is a supervised machine learning algorithm that is based on the ensemble of decision trees, usually trained with the "bagging" method. I split the dataset into 70/30. I used RandomizedSearchCV from sklearn to optimize my hyperparameters. I decided to focus on 3 hyperparameters: n_estimators, max_features, and max_depth.
My results, were: 'n_extimators'=600; 'max_feattures' ='sqrt';'max_depth':300.
My overall accuracy score improved from 0.793 to 0.829.
I had a chance to indicate several necessary factors that influence vaccination intents.
-Education level
-Age
-Income
Models Selection and Enginering
Decision Tree
Random Forest

Recommendations & Strategic Applications Based on Findings
-
Vaccination Education Project
-
Target low-education, younger, and non-anxious populations who show the lowest vaccine intent.
-
Develop culturally tailored materials for Hispanic and minority communities—some clusters showed higher responsiveness to vaccination messaging.
-
Deliver content through channels preferred by low-income and low-access groups, e.g., SMS campaigns, community centers, or local clinics.
-
-
Employee Retention and Recruitment Strategies
-
Use insights on mental health (anxiety) and employment conditions (TW_START) to support workforce planning.
-
Invest in flexible scheduling, wellness programs, and mental health support to reduce employee burnout—especially in sectors affected by pandemic-related stress.
-
Consider targeting unemployed individuals from high-hesitancy regions for vaccine education tied to workforce reentry initiatives.
-
-
Mental Health Public Service Campaigns
-
High anxiety and poor vaccination intent correlate in some groups—indicating that mental health interventions may indirectly increase public health compliance.
-
Focus on destigmatizing anxiety and depression, particularly in older, less-educated communities.
-
Leverage trusted figures and storytelling to normalize conversations about stress, isolation, and psychological support.
-
-
Government Contractor Opportunities for Public Health
-
Use decision tree results to inform grant proposals or bids for initiatives such as:
-
Food security support in high-risk zip codes
-
Housing assistance tied to mental health and health access
-
Vaccination campaigns targeting underserved populations
-
-
Highlight evidence-based segmentation to show data-driven targeting in public sector health outreach.
-

Esports & 2021 League of legends regression analysis
Esports Industry Analysis & Personal Reflection
The Esports industry has experienced explosive growth in recent years. In 2020, the global market was valued at USD 1.48 billion, and it's projected to reach USD 6.81 billion by 2027. Total Esports viewership is expected to increase at a 9% compound annual growth rate (CAGR) from 454 million in 2019 to 646 million by 2023.
A Personal Turning Point
One of my most memorable moments was attending the 2016 League of Legends World Championship semi-finals at Madison Square Garden in New York. Watching SKT vs ROX Tigers in person was electrifying—the skill of the players, the energy of the fans, and the scale of the production felt like the beginning of a new digital sports era. That experience sparked my lasting interest in the industry.
Market Analysis: Genre Dominance
Through my research, I analyzed the competitive Esports landscape and identified that Multiplayer Online Battle Arena (MOBA) games—such as League of Legends, Dota 2, and Arena of Valor—lead the industry in:
-
Viewership
-
Global popularity
-
Tournament prize pools
These games offer strategic depth, large fanbases, and a mature ecosystem for professional players and teams, making them the cornerstone of Esports infrastructure.


2021 League of Legends Regression Analysis
League of Legends: The Flagship of Global Esports
Since its release in 2009, League of Legends (LoL) has become a cornerstone of the global esports ecosystem. As one of the pioneering Multiplayer Online Battle Arena (MOBA) titles, LoL helped define competitive gaming and has remained at the forefront of the industry.
Between 2015 and 2020, the game generated an astounding $10.18 billion in revenue, underscoring not only its massive player base but also the scale of its monetization ecosystem—including in-game purchases, sponsorships, media rights, and merchandising.
Global Reach & Cultural Impact
LoL’s influence extends far beyond gaming—it is arguably the fastest-growing sport globally, especially among younger demographics. According to a Nielsen study (Church, 2021):
The League of Legends European Championship (LEC) reported a higher average minute audience than basketball, tennis, and rugby among viewers aged 16–29.
This crossover into mainstream media highlights a significant generational shift—where esports not only compete with traditional sports but are beginning to outperform them in key audience segments.
Looking Ahead
With its deep strategic gameplay, global tournament structure, and massive streaming presence across platforms like Twitch, YouTube, and even broadcast television, League of Legends is positioned to:
-
Dominate the future of sports entertainment
-
Expand cultural influence across regions
-
Attract non-endemic sponsors from fashion, automotive, and finance sectors


Predicting Match Outcomes in League of Legends Using KDA Metrics
This study leverages 2021 professional League of Legends match data to investigate which gameplay factors most strongly predict match outcomes. The primary focus is on evaluating the influence of Kill-Death-Assist Ratio (KDA) as a key performance indicator at the team level.
Data Overview
-
Source: 2021 match data from Oracle’s Elixir, a trusted repository of League of Legends esports statistics
-
Size: 147,924 observations and 123 variables
-
Key Features: Raw metrics include Kills, Deaths, and Assists, but the dataset did not include KDA directly
To compute the KDA, I created a new variable using the formula:


Methodology
-
Target Variable: Match result (Win = 1, Loss = 0)
-
Initial Model: Logistic regression was used to test the relationship between KDA and match outcomes
-
Result: The model returned a statistically significant p-value (p < 0.05), confirming that KDA is a meaningful predictor of victory
-
-
Feature Reduction:
-
Removed irrelevant or redundant variables (e.g., team name, match ID)
-
Retained 52 predictive variables for further modeling, including objective control (dragons, towers), gold differential, and vision metrics
-
Next Steps
-
Build more advanced models using random forest, XGBoost, and neural networks to improve prediction accuracy
-
Compare KDA’s predictive power against other game metrics (e.g., vision score, gold difference at 15 minutes)
-
Perform feature importance ranking and SHAP value analysis to interpret model decisions
Feature Selection and Dimensionality Reduction
To improve model efficiency and reduce overfitting, I applied domain-informed dimensionality reduction focused on team-level outcomes rather than individual player performance. Based on game experience and the structure of professional League of Legends matches, I concentrated on Kills, Deaths, and Assists—metrics most strongly associated with victory—as primary predictive variables.
To further streamline the dataset, I conducted an initial Variance Inflation Factor (VIF) analysis to identify and eliminate multicollinearity among features. Variables with a VIF score greater than 5 were dropped, reducing the feature set from 51 to 27 variables. Key variables removed during this process included:
-
Early-game metrics: killsat15, deathsat15, goldat15, xpat15, golddiffat15, xpdiffat15, opp_deathsat15, opp_goldat15
-
Macro objectives: dragons, infernals, mountains, heralds, towers, opp_towers
-
Other high-collinearity features: game_length, total_gold, visionscore, goldspend, wardsplaced, minionkills, earnedgold, result
This reduction process allowed the model to focus on the most independent and predictive team-level features, improving both interpretability and model stability.

MODEL SELECTION
Modeling KDA and Match Outcomes: Impact of Playoff Qualification
To assess the predictive power of KDA and related variables on match outcomes, I initially built a baseline model (Model 1) using 18 selected independent variables after dimensionality reduction. This full-sample regression model yielded:
-
R-squared: 0.6093
-
Adjusted R-squared: 0.6087
These results suggest that the model explains approximately 61% of the variance in team-level match outcomes, indicating a reasonably strong relationship between the chosen predictors and KDA.
Evaluating the Impact of Playoff Participation
To further explore how team quality or skill level influences the relationship between gameplay metrics and outcomes, I created two additional models:
-
Model 2: Trained on teams that qualified for the playoffs
-
Model 3: Trained on teams that did not make the playoffs
Both models used the same preprocessed set of variables as Model 1, ensuring consistency across the comparison.
The goal of this approach was to test whether segmenting teams by performance tier (playoff vs. non-playoff) would reveal differences in how KDA correlates with match success, and whether such segmentation could enhance out-of-sample prediction accuracy.
Next Steps
-
Compare R², RMSE, and residual plots across the three models to assess fit
-
Analyze whether KDA has greater predictive power in higher-skilled games (Model 2) versus lower-tier matches (Model 3)
-
Test the generalizability of each model on held-out match data for cross-group validation


RESULT
Model Evaluation & Out-of-Sample Prediction Using KDA Threshold
After developing the three regression models—Model 1 (full dataset), Model 2 (playoff teams only), and Model 3 (non-playoff teams only)—each was subjected to out-of-sample testing. The datasets were split into training and testing subsets, and performance was validated using 10-fold cross-validation to ensure model stability and reduce overfitting.
Model Comparison: Regression Performance
ModelDataset DescriptionR²MAERMSE
1Full Dataset0.632.00–
2Playoff Teams Only0.402.935.28
3Non-Playoff Teams Only0.422.875.15
Model 1 outperformed both segmented models significantly, indicating that including all teams improves predictive generalization for KDA. The segmented models (Model 2 and 3) showed lower explanatory power and higher error metrics, suggesting that splitting the data by playoff qualification may reduce model robustness.
KDA-Based Match Result Prediction
To evaluate how well KDA predicts actual match outcomes, I implemented a binary classification rule using a threshold of 6:
If a team's predicted KDA ≥ 6 → predict a win;
If a team's predicted KDA < 6 → predict a loss
This threshold was selected based on exploratory analysis of the training dataset, where a KDA ≥ 6 was found to be a strong indicator of match success.
Prediction Accuracy by Model
ModelPrediction Accuracy
10.89
30.88
20.83
Model 1 again delivered the best overall accuracy, reinforcing its generalizability and reliability. Interestingly, Model 3 outperformed Model 2, suggesting that KDA may be a stronger predictor in lower-tier (non-playoff) matches, possibly due to less strategic complexity or higher reliance on raw combat metrics.
Conclusion
-
KDA is a statistically significant and practically useful indicator of match success.
-
A threshold-based classification model using KDA can achieve high prediction accuracy, especially when trained on the full dataset.
-
Playoff segmentation introduces variance, and while it can uncover group-specific dynamics, it may reduce overall model performance.
Model 1 Accuracy Results

Analysis of the Housing Market in Two US Cities from 2020-2022
Since the COVID-19 pandemic in 2020, real estate pricing has been quite volatile. The initial lockdowns led to a significant drop in property values across the country, but shortly after that, a considerable spike has continued up until now. The project will implement different machine-learning methods to explore the U.S. housing market.
The motivation behind this project comes from the team members. We are all graduate students interested in purchasing real estate in the future, and we would like to know what to expect from this market. It could also be helpful for bans that give out home loans, mortgage companies, and escrow companies. In addition, anyone that is interested in purchasing a home
- Several datasets were chosen for this project. The first dataset originally came from www.realtor.com. A real estate listing website operated by the New Corp subsidiary Move, Inc. and based in Santa Clara, California. However, this data set contains properties from across the United States. As we are for the context of this project, only focusing on the dataset to get properties in those two states.
- Loan-level Public-Use Databases (PUDBs) are datasets that contain information on individual loans that are insured or guaranteed by the Federal Housing Administration (FHA), the Department of Veterans Affairs(VA), or the US Department of Agriculture's Rural Housing Service (RHS).
PUDBs are commonly used for research and analysis in the mortgage industry and by policymakers. They can be used to examine mortgage market trends, evaluate government housing programs' effectiveness, and assess the impact of various economic factors on mortgage performance.
- The Rolling Sales Data is the dataset that contains information on real estate sales transactions in New York City(NYC). The data is sourced from the NYC Department of Finance's Automated City Register Information System (ACRIS). The dataset includes records of all real estate sales transactions conducted in NYC from January 1, 2010, through December 31, 2020.
The Rolling Sales data is commonly used by real estate professionals, analysts, and researchers to analyze trends in the NYC real estate market, such as changes in property values and the number of sales transactions over time. The dataset can also be used to study the impact of various factors on real estate prices, such as changes in interest rates, the local economy, and demographic trends.
Data We Use
